
 I was checking our Visitor stats in Analytics when I noticed that over the last 30 days, Mexico was nr. 2 in my top countries list, accounting for 8% of my visitors.
Mexico? We hardly ever sell to Mexico.
A quick peek at the Ecommerce tab confirmed that: In the same period only 0.37% of my sales came from Mexico. This wouldn’t be much of a problem if all that traffic was organic and thus free. But what if I am paying for those visitors with Adwords?
Sadly, information like that is not readily available from your Adwords interface. You will have to run a Geographic Performance report to get to the data. And even then, it takes some work to turn the data into actionable information.
But, it’s definitely worth doing. For instance, I found that for the past five months, a considerable part of my Adwords spend had been going to Mexico and a couple of other countries (Greece, Spain) that were not resulting in enough sales.
So I highly recommend that you spend some time to analyze your own Geographics Performance report. To help you do it, I have created a step-by-step tutorial on creating and analyzing this important report type. Here we go…
Creating the report
Start with running the report and saving the report data:
- In your Adwords account, choose Reporting, then Reports from the drop-down menu.
- At the top, choose Create a New Report
- Under Report Type, choose Geographic Performance
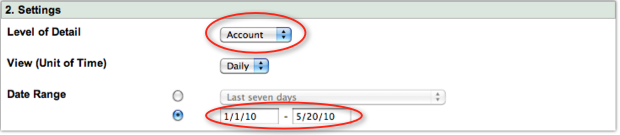
- Under Settings,
- Set Level of Detail to Account
- The View (Unit of Time) setting is fixed to Daily. I would prefer to use the Summary option here, but it is not available for Geographic Reports. Oh well, we can do the aggregation ourselves with Excel or Calc…
- Choose a Date Range that gives you sufficient data (I’d recommend to select a couple of months of data, maybe even more)
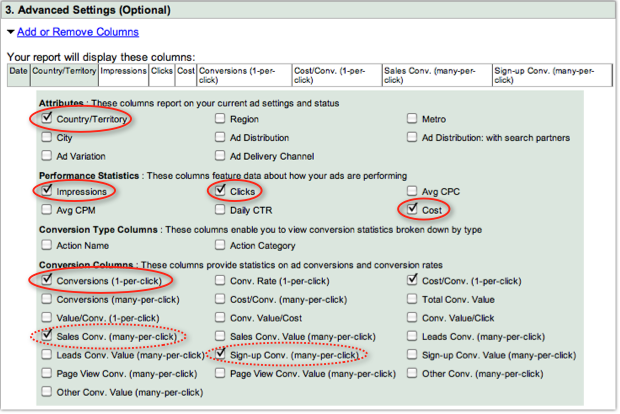
- Under Advanced Settings, click Add or Remove Columns, then check choose the following columns:
- under Attributes: I’d recommend to select just Country/Territory, unless you’re doing local ads.
- under Performance Statistics, choose Impressions, Clicks and Cost
- under Conversion Columns, choose Conversions (1-per-click), or if you are tracking your sales and sign ups separately (like I do), then choose the Sales Conv and Sign-up Conv fields instead.
- Click “Create Report” at the bottom and wait for it to complete.
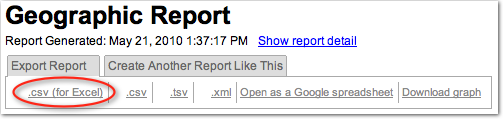
- Open the report, then at the top left choose Export Report and click “.csv (for Excel)
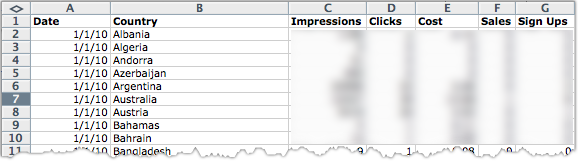
We now have the raw Geographic Performance data saved on our computer. Let’s open it in Excel or Calc to massage it into something useful.
- Now open the saved CSV file in either Excel or OpenOffice Calc. Note that Adwords report are called CSV (as in COMMA Separated Values), but are actually TAB separated. So make sure you choose Tab as the delimiter when importing.
- (At this point you may want to Save the report in your spreadsheet’s native format, .XSL for Excel or .ODS for Calc.)
- Delete the top 3 rows (REPORT, ACCOUNT and DATE RANGE) and the bottom row (Totals) from the sheet.
- I also like to:
- Make the header row bold so that it stands out more
- Rename some of the column headers to something shorter (e.g. Country, Sales, Sign Ups).
This should give you a sheet that looks like this:
Aggregating the data per country using a Pivot Table
As you can see, the Geographic Performance Report gives us performance data per country per day, not very useful. To get a useful summary per country, we need to aggregate the data by country using a Pivot Table (or as OpenOffice Calc calls it, the Data Pilot). Here’s how to do that:
- Select the entire sheet by hitting Ctrl-A (or Cmd-A for us Maccies).
- In Excel, choose Data / PivotTable Report. (or in Calc, use Data / DataPilot / Start).
(the following steps may differ depending on your version of Excel or Calc, but the main thing to get right is the Layout) - As the destination of the pivot table, choose New Sheet (in Calc, this is under More / Results to).
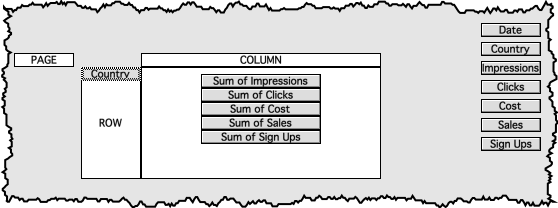
- For the Layout of the pivot table, drag the Country field to the Row box and drag the Impressions, Clicks, Costs and Conversions fields to the Data box.
- Make sure the Data box now says “Sum of …” for all fields. Double click each field to change it if necessary. (For some reason my Mac Excel defaults to “Count of …”.)
- Leave the Column box empty.
Like so:
After generating, this will result in the following pivot table:

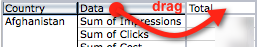
- We selected multiple data fields and by default these appear vertically arranged. However, we want to be able to sort on each of these fields, so we prefer to have them as separate columns. To make that happen, just drag the header of the Data column one cell to the right and drop it on the cell that says Total (in Calc that cell is empty).
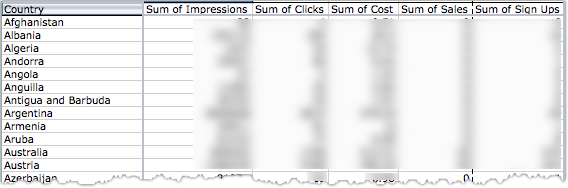
And presto, we have an aggregated performance report by Country, with nice totals for Impressions, Clicks, Costs, Number of Sales (and in my case, Number of Sign Ups):
Analyzing the data
Now the fun begins. Let’s see where we are making money and, more importantly, where we are losing money.
- First sort the table on the Cost column. This may already provide some eye-openers. For instance, I saw Mexico appearing as the fourth country from the top.
- Now let’s create a column that is a rough estimate of our earnings in each country. Just call it Revenue or something like that. In the first data cell of that column, use a simple formula ito fill it with the Number of Sales times your average sales value (e.g. “=E5*60”). Copy that formula down the entire column (just click in the cell and drag its bottom right corner down).
- Create a 2nd new column called “Margin” and use another formula to fill it with the value of the Revenue column minus the Cost value (for me, that became “=G5-D5”). Again, copy it down for all cells in that column. This Margin column is essential, as it shows us whether we are making money or losing money. Hint: negative values are bad 🙂
- To make the negative values stand out more, I use Conditional Formatting (Formats menu) to set the background of values < 0 to red.
The result:
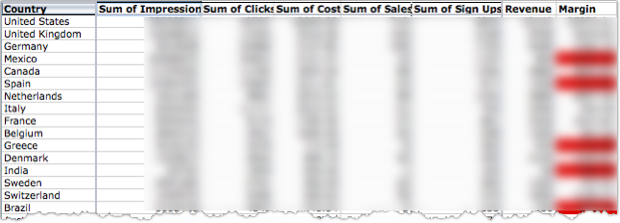
Now take a close look at the countries with a red Margin box, especially the ones near the top and the ones where you are loosing a lot of money. Try sorting on this new Margin column to quickly find the biggest money wasters.
How to use this information?
As promised in the introduction, I have shown you how to turn the raw geographic data into actionable information. But what action should you take?
Should you modify your Campaign settings to remove the “bad” countries and stop advertising there? Or should you try to improve your sales process for those countries? In other words, to fix your negative margins, do you fix the Cost side or the Revenue side?
The easy way out is to remove the countries from your Campaign Settings. But before you do, try to think of the reasons you are not selling well in these countries? For example, if sales in Germany are below par, this could be because you are not offering specific local payment methods that are popular in Germany. Or maybe you need to consider translating your product and/or creating a localized “punkt de” website.
Modifying your Campaign Settings
If you do decide to stop advertising in the “red” countries, either permanently or temporarily (while you optimize your sales process), here’s how to modify your Adwords settings. In Adwords, Location settings are at the Campaign level, so you will have to modify these settings separately for each campaign in your account. But don’t worry, there’s a trick in Adwords Editor that lets you copy country settings between campaigns.
For the first campaign I like to modify the Location settings in the online Adwords interface (the bundles and the map make it a bit easier to find the countries):
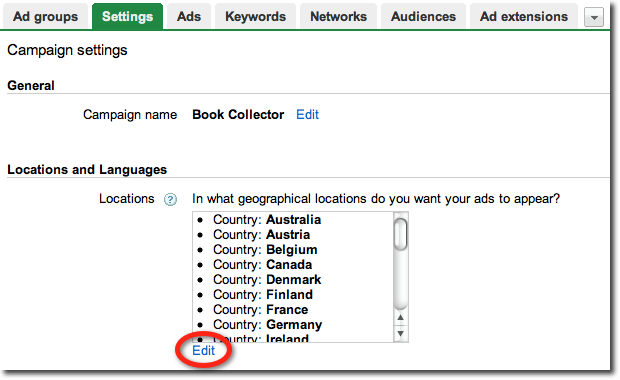
- Go to the Campaigns tab in your Adwords account.
- Click the first campaign in the navigation bar on the left.
- On the right, go to the Settings tab.
- Under Locations, click the Edit link.
- This will open the “Select a Location” pop-up.
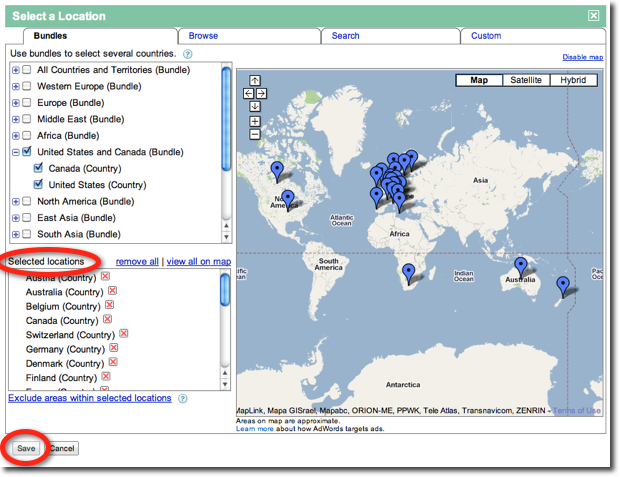
- Modify the list of locations here, removing your bad countries. Make sure to verify the list of remaining one under “Selected locations”.
- Click Save.
That’s one down. Now if you want to use the same Location settings for other campaigns, I recommend to use Adwords Editor because it lets you copy/paste the settings from one campaign to another:
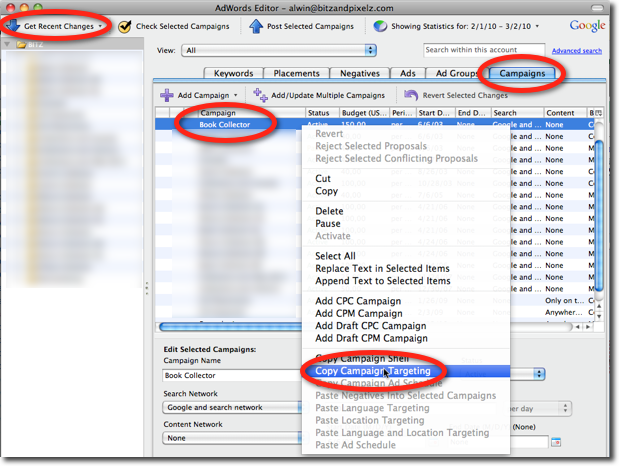
- Start Adwords Editor and Get Recent Changes.
- On the right, go to the Campaigns tab.
- Select the campaign for which you already modified your Location settings in the online interface.
- Right click that campaign and from the context-menu, select Copy Campaign Targeting.
- Select a campaign that you wish to copy the Location settings to.
- At the bottom, to the right of Location Targeting, choose Paste.
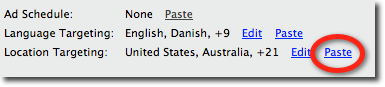
- Do the same for the other campaigns that need the same targeting. No need to Copy Campaign Targeting again, just hit the Paste link for all of them.
A word of warning though: it may make sense to have different Location settings per campaign. Considering the targeting of your campaigns and products and decide which countries you want to advertise to in each one. If necessary, re-run the above steps to generate a campaign specific Geographic Performance report.
Your results?
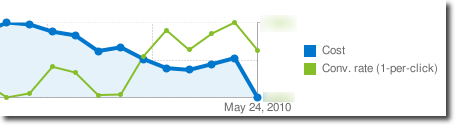
Here’s what happened to my Adwords account after I performed the above steps:
Costs dropped, conversion rates increased…
How did it work out for you? Did you discover locations where you were losing money? What happened to your daily costs after modifying your Location Settings?
I would love to hear about your results, just post below.
I had similar problem: I always burned all of my daily budget, with nothing to show for it. I even got reasonable conversions. But — it was for subscription to pre-release notification list and some 95% of visitors were spammers trying to post spam on my site. It turned out that all such “bad” clicks came from Content Network, with lot of it coming from dubious domains that had nothing but AdSense on them. For now, I just limited my campaign to search.
Helpful as always, a big thank you!
I just make multiple campaigns with the same adgroups and keywords and target each of them ONLY to for example UK, US, etc.
So:
Campaign ‘widgets A1 – US’ -> US only
Campaign ‘widgets A1 – UK’ -> UK only
Campaign ‘widgets A1 – AU’ -> AU only
that way I can analyse my ROI much quicker also 🙂